LightDep is a small model that screens for depression risk from face landmarks and audio features in short videos, small enough to run on a phone. The paper was accepted at IEEE ANTS 2026. To get a small model to perform well, we used knowledge distillation: train the small "student" to imitate a bigger "teacher". We used one recipe on two public datasets. On the first it did nothing useful. On the second it gave a large, repeatable gain.
The part that surprised me most: on the dataset where it worked, the teacher was less accurate than the student we were trying to improve. This post is about why, and what I now check before distilling from any teacher.
Distillation in two minutes
A normal classifier learns from hard labels. A clip is either "depressed" (1) or "not depressed" (0). A teacher gives soft labels instead, like "65% depressed". Two clips with the same hard label can get very different soft labels, say 0.95 and 0.55, and the student learns that one is a clear case and the other is borderline. Hinton and colleagues called this extra information "dark knowledge".
Our task has only two classes, and that turns out to matter. Once you know P(depressed), you know P(not depressed). So the only extra thing a soft label carries is how confident the teacher is on each clip. Keep that in mind, because the whole result comes back to it.
This is the loss we used for the student (LightDep-M, 3.67M parameters):
def kd_loss(student_logits, labels, teacher_logit, T, alpha, beta, label_smoothing):
    ce = F.cross_entropy(student_logits, labels, label_smoothing=label_smoothing)
    log_s = F.log_softmax(student_logits / T, dim=-1)
    soft_t = F.softmax(teacher_logit / T, dim=-1)
    kd = F.kl_div(log_s, soft_t, reduction='batchmean') * (T * T)
    return alpha * ce + beta * kd
With alpha = 0.3, beta = 0.7 and T = 4, the student learns 30% from the dataset labels and 70% from matching the teacher's softened probabilities (KL(teacher ‖ student), scaled by T² so the weights stay meaningful at any temperature). Every result below is a mean over five training seeds (42 to 46), compared with paired per-seed t-tests.
LMVD: nothing we tried worked
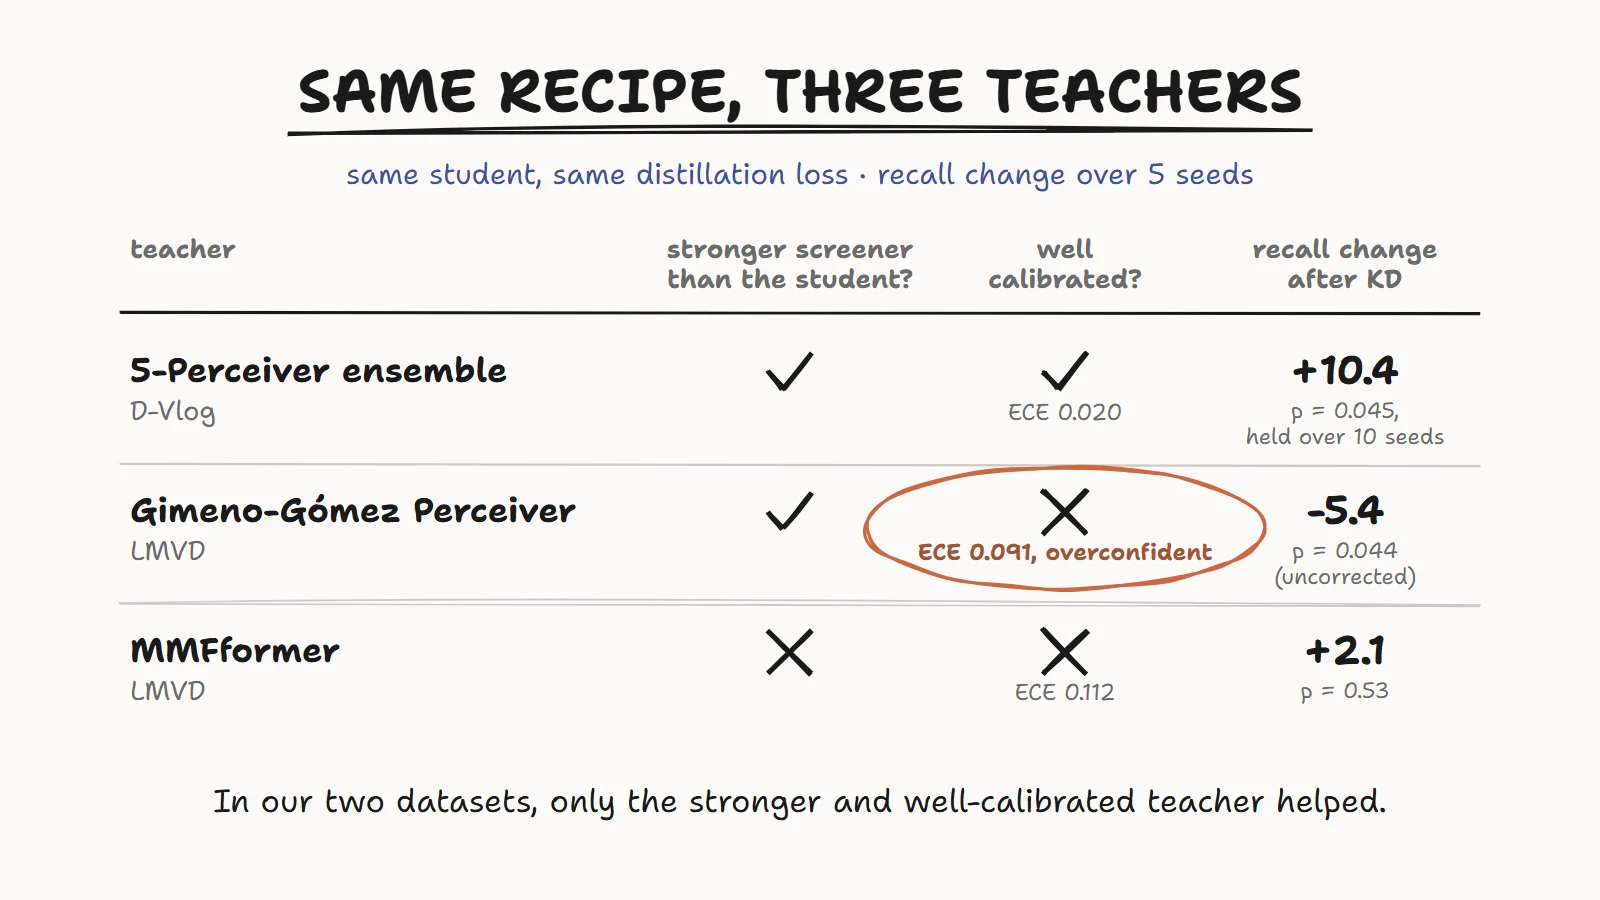
We started on LMVD, using two published teachers: the Perceiver model from Gimeno-Gómez et al., and MMFformer (223M parameters). Distilling from MMFformer changed recall by +2.1 points (p = 0.53), so nothing. Distilling from the Gimeno-Gómez Perceiver went the wrong way: recall -5.4 (p = 0.044) and BinF1 -2.9 (p = 0.037). BinF1 here means the F1 score of the depressed class.
We tried 13 variants in total: different loss weights, temperatures of 1, 2 and 4, and a separate temperature for the Gimeno-Gómez teacher. None significantly improved accuracy or BinF1. Three 3-seed variants showed recall gains with p below 0.05, but 13 variants times 3 metrics is 39 comparisons, and at p < 0.05 chance alone gives you about two hits. None survived correction for multiple comparisons, and the one variant we re-ran with five seeds shrank from +3.1 to +2.3 recall (p = 0.52). By the same rule, the Gimeno-Gómez drop is a single uncorrected p-value too, so the honest summary is that nothing clearly helped.
The odd part was that the Gimeno-Gómez teacher was the better screener. On the LMVD test set it had BinF1 78.9 and recall 79.8, against 74.7 and 72.2 for our student trained from scratch. A stronger teacher made the student no better.
D-Vlog: it worked, and it held up
On D-Vlog we used a different teacher: five Perceiver models (5.6M parameters each) with their predictions averaged. Same recipe, same student. Over five seeds, recall went from 72.0 to 82.4 (+10.4, p = 0.045) and BinF1 from 71.6 to 75.9 (+4.3, p = 0.048).
That isn't much to stand on. With five seeds, p = 0.045 is weak, and after Holm correction across the four metrics those p-values become 0.18. A reviewer asked for more seeds, and they were right to. We repeated the comparison with ten seeds on a second GPU (an NVIDIA T4), retraining both the scratch and the distilled models. Distillation won on 9 of 10 seeds. Recall rose by 11.1 points, BinF1 by 7.0 and accuracy by 6.8, all with p ≤ 0.003 after Holm correction. (Precision also passed, but we don't lean on it, because on the first GPU it went slightly down.) The spread across seeds also shrank: BinF1 standard deviation went from 3.8 to 1.7.
There is a catch in that +7.0. The distilled models scored almost the same on both GPUs, but the scratch models were weaker on the T4. Part of the bigger gap comes from a weaker baseline, not from distillation doing more. So we describe the BinF1 gain as somewhere between +4.3 and +7.0 depending on the run, not "+7".
What was different about the teachers
We went back and measured each teacher's calibration. A model is well calibrated if its probabilities mean what they say: when it says 70%, it's right about 70% of the time. Expected calibration error (ECE) measures the average gap between confidence and accuracy, so lower is better.
| Dataset | Teacher | Better screener than the student? | Teacher ECE | Recall change after KD | p |
|---|---|---|---|---|---|
| D-Vlog | 5-Perceiver ensemble | Yes | 0.020 | +10.4 | 0.045 |
| LMVD | Gimeno-Gómez Perceiver | Yes | 0.091 | -5.4 | 0.044 |
| LMVD | MMFformer | No | 0.112 | +2.1 | 0.53 |
The only teacher that helped was the one that was both a stronger screener and well calibrated. The Gimeno-Gómez teacher was stronger but overconfident: 54% of its test predictions were above 0.9 or below 0.1. If the only dark knowledge in a binary task is the teacher's confidence, then copying a teacher whose confidence isn't earned gives the student very little, plus the teacher's confident mistakes.
The teacher was less accurate, and it still helped
Here is the D-Vlog comparison on the best checkpoints (for each setup, the seed with the highest test macro-F1):
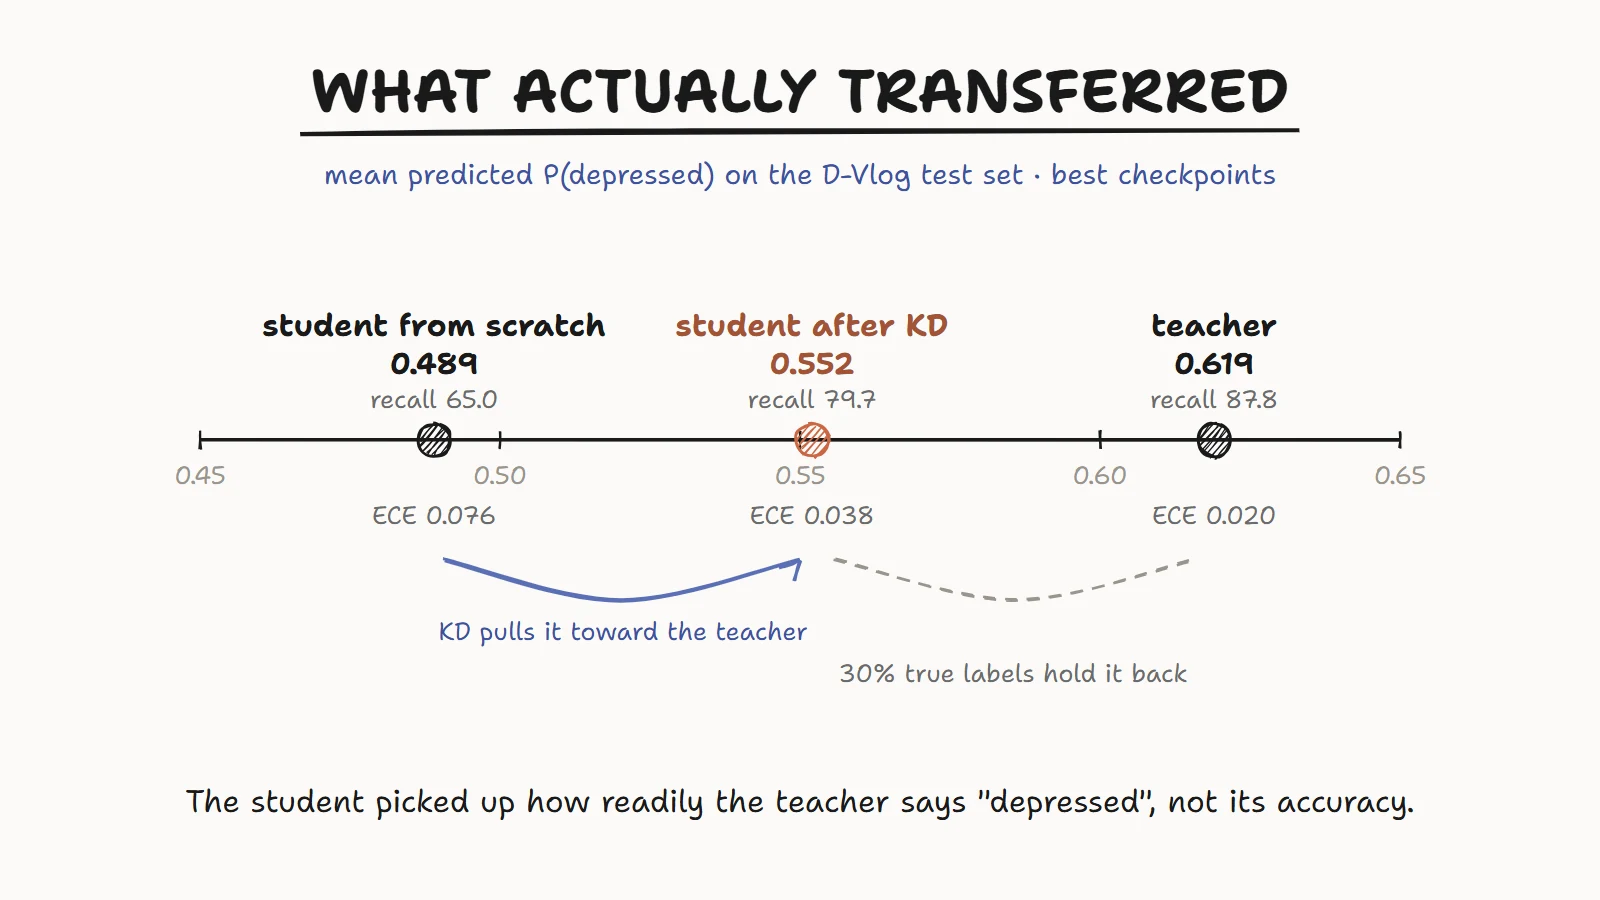
| Accuracy | Recall | Mean P(depressed) | ECE | |
|---|---|---|---|---|
| Student from scratch | 69.3 | 65.0 | 0.489 | 0.076 |
| Teacher | 67.5 | 87.8 | 0.619 | 0.020 |
| Student after KD | 70.8 | 79.7 | 0.552 | 0.038 |
The teacher was less accurate, yet it caught far more depressed people. Working the errors out from these metrics on the 212-clip test set, the scratch student missed 43 depressed clips and raised 22 false alarms, while the teacher missed only 15 and raised 54. Accuracy counts both mistakes the same. For screening they aren't the same: missing someone who needs help costs far more than suggesting an unneeded follow-up check.
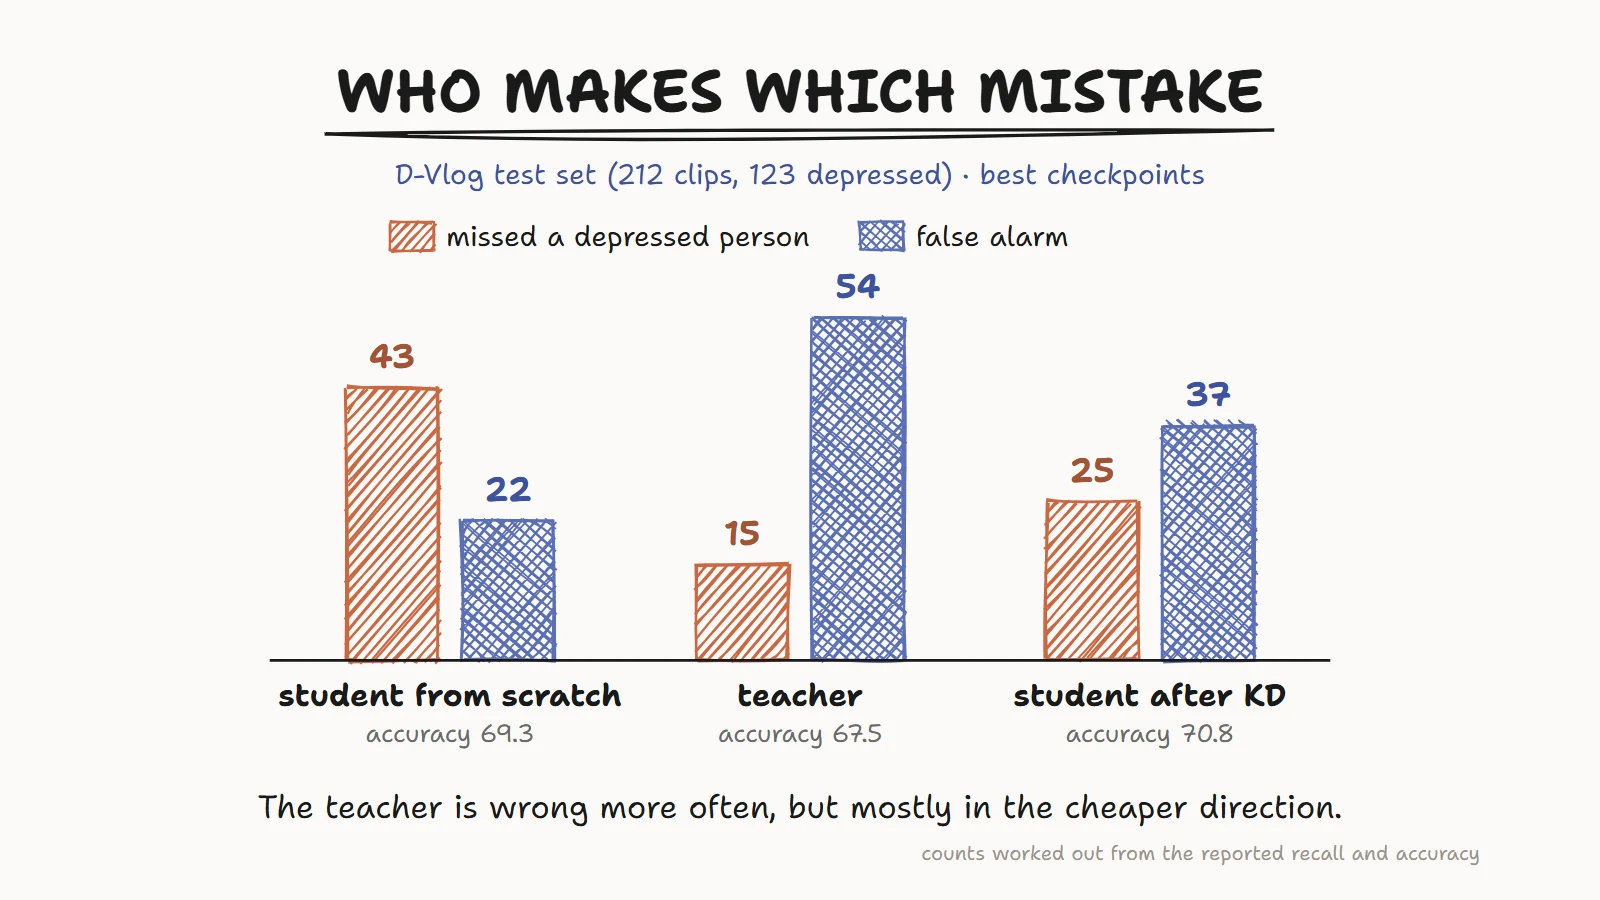
After distillation, the student's mean predicted probability moved from 0.489 toward the teacher's 0.619, landing at 0.552. It missed 25 depressed clips instead of 43, with 37 false alarms, and its ECE fell from 0.076 to 0.038. It didn't move all the way to the teacher, because 30% of its loss still came from the true labels. So what transferred wasn't accuracy, since the teacher didn't have more of it. It was the teacher's operating point (how readily it says "depressed") and its calibration.
One more experiment points the same way. A single Perceiver teacher gave the same recall gain as the ensemble (+10.4, p = 0.042). The two teachers had almost the same calibration (ECE 0.021 vs 0.020) and mean predicted probability. The ensemble added a little accuracy (+1.6, p = 0.021) and BinF1 (+0.95, p = 0.011) at identical recall, which fits the idea that recall follows the teacher's operating point.
How we measured calibration
This is the ECE function from our analysis script. For a binary model, confidence is the probability of whichever class it predicts:
def ece(probs, labels, n_bins=10):
    conf = np.maximum(probs, 1 - probs)          # confidence of the argmax class
    pred = (probs > 0.5).astype(int)
    correct = (pred == labels).astype(float)
    bins = np.linspace(0, 1, n_bins + 1)
    e = 0.0
    for lo, hi in zip(bins[:-1], bins[1:]):
        m = (conf > lo) & (conf <= hi)
        if m.sum() > 0:
            e += m.mean() * abs(correct[m].mean() - conf[m].mean())
    return e
It bins predictions by confidence and takes a weighted average of the gap between each bin's accuracy and confidence. Since binary confidence is never below 0.5, only five of the ten bins are ever used.
Check your teacher before you distill
This is what I'd do next time, before spending GPU hours on distillation:
- Measure the teacher's ECE on a held-out set, the same way you'll measure the student's.
- Plot a reliability diagram. ECE is one number and hides direction. The plot shows whether the teacher is overconfident or underconfident, and where.
- Compare mean predicted probabilities. Look at the teacher's mean P(positive) next to the student's and the true positive rate. That tells you which way distillation will push the student's operating point.
- If the teacher is miscalibrated, consider recalibrating it first, for example by fitting a temperature on the validation set. That's not the same as the distillation temperature, which in a two-class problem changes how hard the student is pulled, not what it is pulled toward. We haven't tested this yet, so treat it as a suggestion.
- Replicate over seeds and correct for multiple comparisons. Five seeds gave us p = 0.045, which I wouldn't trust on its own. The ten-seed run is what the claim actually rests on.
What this does not prove
- It's two datasets, not a law. Besides teacher calibration, D-Vlog and LMVD differ in size, audio features, teacher architectures and how strong the scratch student already was. Calibration fits the evidence best, especially the Gimeno-Gómez result, but we can't call it the cause.
- The mechanism numbers are best checkpoints. The "ECE 0.076 to 0.038" comparison is one seed each. Over five seeds the distilled student's ECE is 0.049 ± 0.010, and we never measured a five-seed ECE for the scratch student. So we can't say ECE halves on average.
- The five-seed p-values are weak. That's why the ten-seed replication carries the claim.
- The labels come from social media, not clinical diagnoses. LightDep is a screening-risk indicator, not a diagnostic tool.
- We didn't test a tuned decision threshold for the scratch student. Lowering its threshold would also raise recall, and that's a baseline worth running.
The experiment that would settle it is to change only calibration: make the D-Vlog teacher overconfident without moving any prediction across 0.5, so its accuracy and recall stay identical, then distill again. If the gain disappears, calibration is doing the work. The reverse, recalibrating the Gimeno-Gómez teacher on LMVD, would be just as useful.
Links
The paper will appear in the IEEE ANTS 2026 proceedings, and I'll add the link here once it's out. The code, results and analysis scripts are on GitHub: github.com/devansh101005/Depression_Detection_KD_Edge. If you've seen distillation behave like this on other tasks, I'd like to hear about it.